Cari dalam skrip untuk "inside bar"
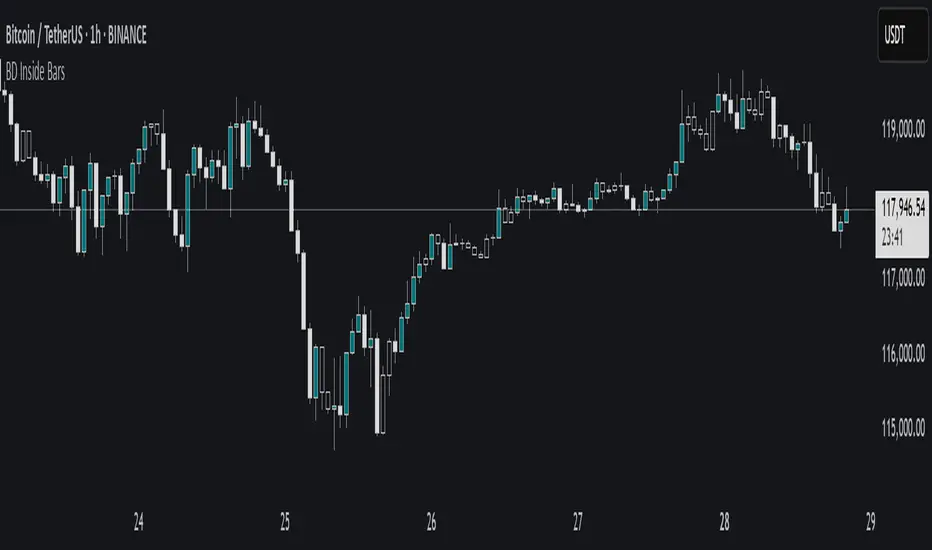
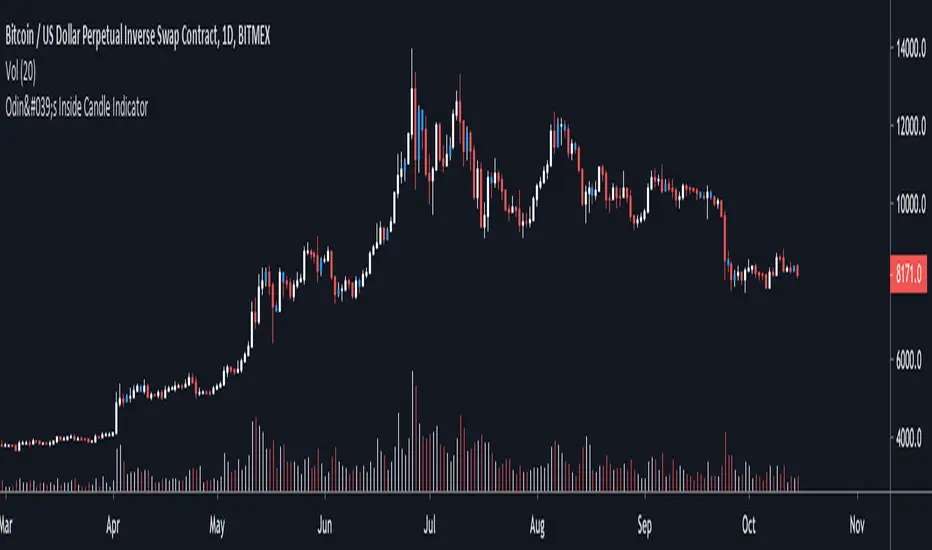
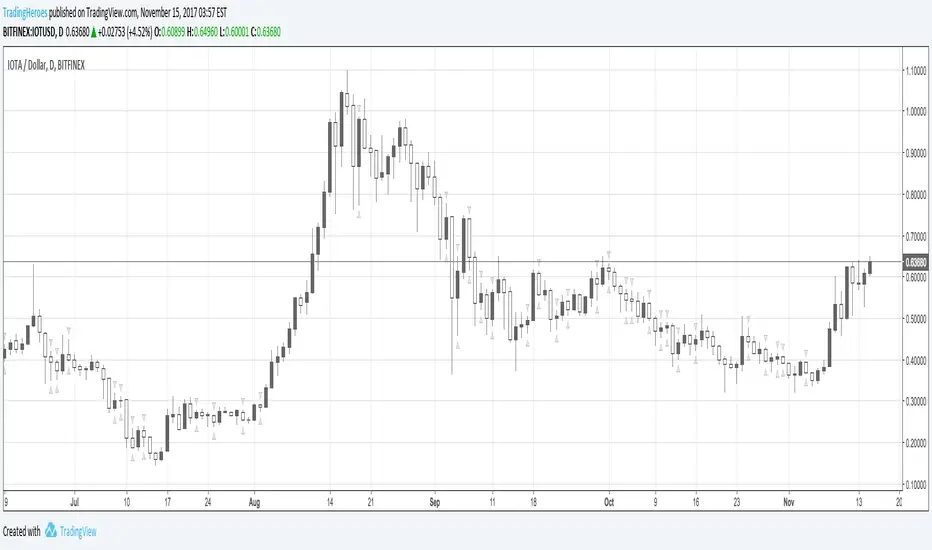
Odin's Inside Bar IndicatorA simple indicator that identifies "inside bars" by painting them blue.
An inside candle is a candle that has a lower high and higher low than the previous candle.
I like to use it on the daily chart to find areas of price compression that lead to a breakout.
The price then often trends in the direction of the breakout.
Especially powerful when combined with other market structure analysis.
Cheers.
vwap inside bar jmrjm vwap inside bar which helps to take guage trend with vwap and and help to understand when market taking pause due to bulls and bears fight. Then we can take a trade in trend with winners.

GT HIGH/LOW - MRB (Inside Bar)This indicator works out the current highs and low, and new highs and low.
The MRB functionality is for inside bar, although its in BETA stage at the moment - you can turn the MRB off via the settings.

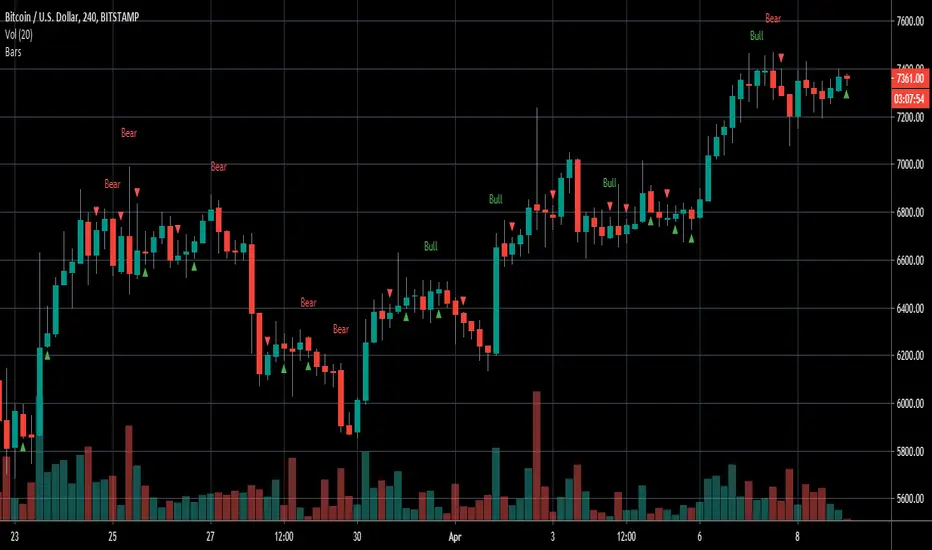
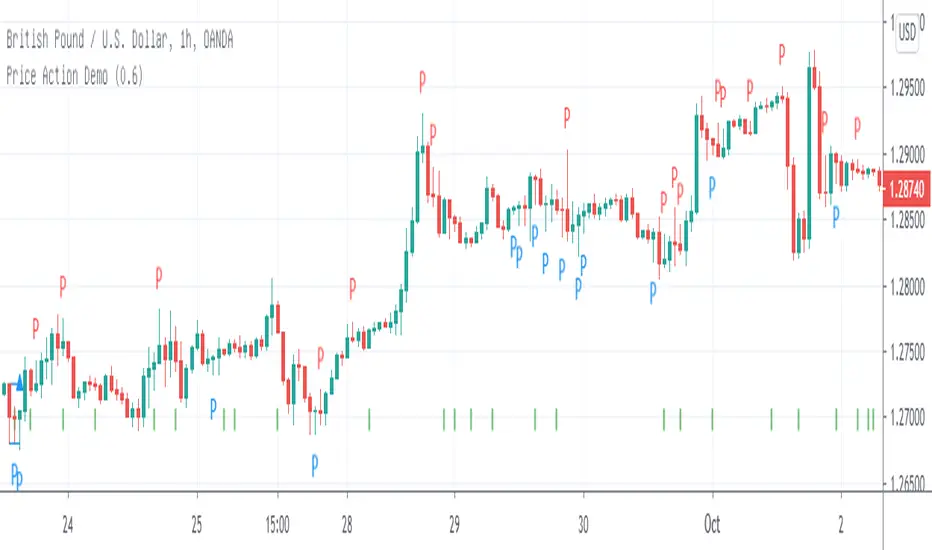
Engulfing/Inside BarsVery basic script to help discretionary traders with their candlestick pattern analysis
This script shows a colored arrow on top or below the candlestick indicating a bearish/bullish inside bar formation
also shows text with "bull" or "bear" on top of the candle when a bullish or bearish engulfing pattern surges.
big thanks to the pinescript reference manual & everyone that has open source codes bc i got stuck 50 bajillion times
Cheers.
TGs Inside Bar PlotThis Script is quite simple.
Colors your inside bars on any time frame Blue.
If you would prefer another color. Please contact me thru here
and I will change one specifically for you.
Hope it helps.

Elite By Ashu4750Inside Bar Detection:
The script identifies inside bars, which are candles where the high is lower and the low is higher than the previous bar. It tracks the high and low of the mother candle (the candle preceding the inside bars) and plots the ranges on the chart using lines and labels.
Exponential Moving Averages (EMA):
Three EMAs are calculated and plotted (with default periods of 9, 21, and 50). This is a classic trend-following technique used to smooth price data and identify the direction of the market.
Bollinger Bands (BB):
The script includes a Bollinger Band calculation using the simple moving average (SMA) with a standard deviation multiplier. The bands help visualize volatility and potential overbought or oversold conditions.
The user can configure settings like the length of the SMA and the multiplier for the upper and lower bands.
Volume Weighted Average Price (VWAP):
The VWAP is plotted on the chart and reset based on user-defined timeframes (e.g., session, week, month). VWAP is a popular indicator for institutional trading, as it shows the average price weighted by volume and can act as support or resistance.
Crossover Signals (Buy/Sell):
A combination of crossovers between VWAP, EMAs, and Bollinger Bands triggers buy and sell signals. Specifically:
Buy signal is generated when VWAP crosses over the 9 EMA, the close crosses over the Bollinger Band line, and VWAP crosses over the Bollinger Band.
Sell signal is triggered when VWAP crosses under the 9 EMA, and similar conditions exist for the other indicators.
These signals are plotted with a green "Buy" or red "Sell" marker below the bars, and alerts are set up for both buying and selling.
Additional Bollinger Band Configuration:
The script provides more flexibility in Bollinger Bands by allowing the user to select between SMA, EMA, or SMMA for the moving average.
The user can also choose the standard deviation multiplier and whether to display the bands.
Alerts:
Buy and sell conditions are linked to alert conditions, allowing the user to be notified when a signal is triggered, based on the defined crossover logic.
Technical Breakdown:
Inside Bar Logic: Tracks inside bars and plots lines representing the high and low of the mother candle. The line and label functions are used to draw these on the chart, which provides a visual representation of the range.
EMA and VWAP Crossovers:
The 9, 21, and 50-period EMAs are calculated and used in crossover logic with VWAP. Crossovers between VWAP and EMAs are a common method for identifying potential trend changes.
Bollinger Bands:
The Bollinger Band component allows for volatility analysis by calculating the upper and lower bands based on the moving average's standard deviation.
Alert System:
Alerts are set for crossover signals, allowing for real-time notifications of potential buy and sell opportunities.
Visualization:
The script plots the EMAs, VWAP, and Bollinger Bands on the price chart. It highlights inside bar patterns and displays buy/sell markers on the chart when the specified conditions are met. These visual cues make it easier to follow the market’s movements and spot trading opportunities.
Customizability:
The script is highly customizable with inputs for:
EMA periods.
VWAP settings.
Bollinger Band parameters (moving average type, length, standard deviation).
Candle color options for inside bars.
In this traders looking for multiple indicators to analyze market trends, volatility, and price action.

Inside and Outside BarsInside Bar:
An inside bar forms when the high and low range of a candlestick is within the high and low range of the previous candlestick.
In other words, the current candlestick's high is lower than the previous candlestick's high, and the current candlestick's low is higher than the previous candlestick's low.
Inside bars indicate a period of consolidation or indecision in the market. They often occur after a strong move in price and can signal a potential reversal or continuation of the trend, depending on the context.
Outside Bar:
An outside bar (or engulfing bar) forms when the high and low range of a candlestick completely engulfs the high and low range of the previous candlestick.
In bullish outside bars, the current candlestick's high is higher than the previous candlestick's high, and the low is lower than the previous candlestick's low.
In bearish outside bars, the current candlestick's high is lower than the previous candlestick's high, and the low is higher than the previous candlestick's low.
Outside bars often indicate a significant shift in market sentiment. Bullish outside bars suggest increased bullish momentum, while bearish outside bars suggest increased bearish momentum.

InsideBar2.0Inside Bar: Inside Bar is defined as, " when candle body range falls within previous day candle body".
Some of us take the whole prices range . Here i have taken only the price range of the body of tehecandle.
I have created an indicator to identify Inside bras and draw target levels on both the sides. Traders can easily convert it into a strategy and checkout the success rate.
This script is written to identify InsideBar and then plot target 1 and target 2 irrespective the direction of following candles.
Inside Bar is here defined clearly when the whole body( Not high/Low, but Open and Close Only of the candle falls within the whole body of previous candle
Few static Variables are declared for one time use to store the following values
MotherCandle Index
High and Low of MotherCandle
Target 1 equal to size of the body of mother candle
Target 2 equal twice the size of Mother Candle
Depending upon the direction of the trend and breakout of the MotherCandle boundaries, target lines and labels are drawn.
Line.delete function is used to delete all the previous lines to keep the chart clean and not draw line on all every inside-bar detected in the past.
Label.delete function is used to delete all the previous labels for Target levels to clearly show current target levels.
barcolor() function is used to change the inside bar candle changed to "Yellow" .

Inside Reversal Engulfing BarInside bar bullish = yellow
Inside Bar bearish = orange
engulfing bar bullish = green
engulfing bar bearish = red
reversal bar bullish = blue
reversal bar bearish = purple


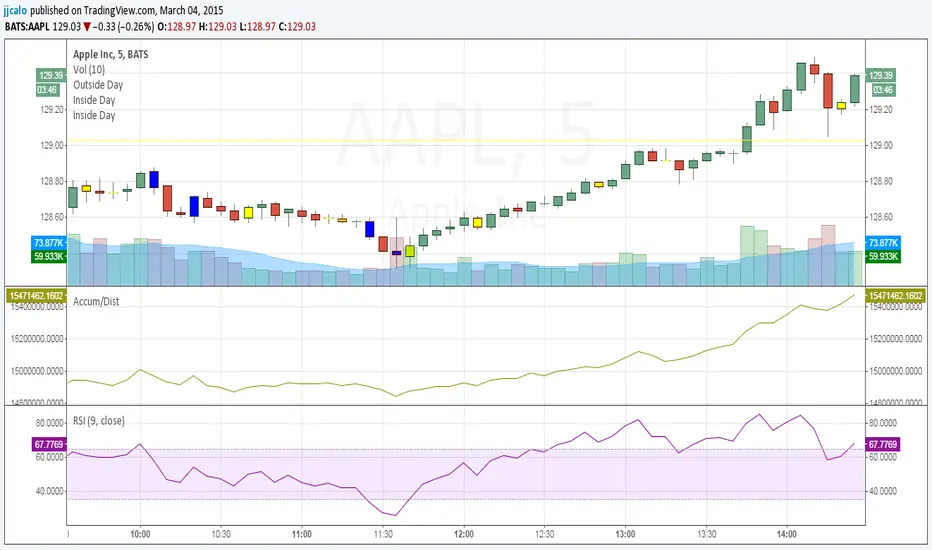
jc-Inside_BarCopyright by jack calo -- v1.0 -- 03/04/2015 -- Paint the bar yellow when it's an inside day. When the full range of a candle is equal or within the full range of the previous bar. Credit to Rob Smith and his In The Black Strategy.

Inside barИндикатор, который подсвечивает внутренний бар. Не использовать в качестве сигнального индикатора.

Ryan's Candle Comboinside bar breakouts and reversal moves. version 1. use however u like it I cannot guarantee profitability :)

Advanced Candlestick Patterns [vitruvius]This is a very advanced indicator that detects most commonly used candlestick patterns. Please read this document carefully to understand how it works.
It is tailored to identify patterns that only have a great possibility of signaling a price movement. In other words, it can and will ignore some patterns, even though they satisfy the recognition conditions defined in the books. Candlestick patterns should also satisfy some other conditions in this indicator to be valid and you can modify those conditions.
This indicator is not only about identifying the candlestick patterns. By using the different choices, you can:
Avoid fake signals
Confirm patterns
Increase your possibility to win a trade
Reduce risk
Identify bullish/bearish movements better
Recommended Use
This indicator works best when you:
Use it in the daily time frame
Combine it with Support/Resistance areas
Note: For some candlestick patterns, you have the option of confirming the pattern with the next price action. In those cases, there will be obviously one bar delay (because it will wait for one more bar to close to confirm the pattern). However, it will mark the candlestick where it identifies the pattern and it will have ”Confirmed” in its text.
Important Note
This indicator does some serious calculations and checks for a lot of user inputs. Therefore, it might be a little slow. Please give it some time when it needs to do some computing.
MODULES
Trend Detection
Most of the patterns in this script are trend reversal patterns. So, recognition of the candlestick patterns depends heavily on the trend. In fact, even if you do not select a trend detection method, it will use the SMA method as default where it needs a certain trend in identifying a specific pattern.
It is possible to combine multiple trend detection methods. You can see how this affects the overall trend detection by enabling the background coloring.
Note: There might be some cases where a candle has a bullish/bearish confirmation of the same candlestick pattern . In those cases, the script is unable to identify the move and the user should decide if the identified pattern is bullish or bearish.
Below are the inputs of this module:
Color the background according to the trend?
If you select a trend detection method, it will color the background green for an uptrend and red for a downtrend .
Counter the trend when there is no obvious trend?
If you select multiple trend detection methods, there might be some cases where one of the methods indicates an uptrend and the other one indicates a downtrend . In that case, the script will continue with the previous trend (whatever the trend is one bar ago) by default . You can, however, reverse the trend in those cases by using this option. If you choose to reverse, you might catch the trend early .
Use MACD to detect the trend?
Use MACD to detect the trend. Whenever MACD delta is greater or equal to zero, it is an uptrend .
MACD Fast Length
Fast length of MACD.
MACD Slow Length
Slow length of MACD.
MACD Signal Smoothing
Signal smoothing value of MACD. Please note that it is set to 6 by default.
Use SMA to detect the trend?
Use SMA to detect the trend. If the price closes above the SMA line, it is an uptrend
SMA Length
Length of SMA.
Use the average price of previous candles to detect the trend?
If the average of open and close prices constantly go up for n bars that are determined by the next user input, it is an uptrend .
Number of candles to analyze
The number of bars ( n ) to analyze for the average price method.
Use the closing price of the previous candle to detect the trend?
If the difference between the current close and nth previous bar’s close is greater than the given threshold, it is an uptrend .
Position of the previous candle to analyze
Position of the bar (backward) to compare with the current close price.
Threshold for the closing price
The threshold value for closing price method.
Basic Candlestick Patterns
This module detects Doji, Spinning Top, Marubozu candlestick patterns. Also, you can set some specific options that are going to be used in all candlestick patterns.
Note: If you choose to manually enter the body height of a doji , you need to find the optimal value for different timeframes. Different timeframes have difference price action ranges.
Below are the inputs of this module:
Tolerate opening/closing price of the candle?
When a candlestick pattern needs to have a gap between two candles, you can tolerate the opening/closing prices of the one candle. This option is useful where the opening and closing prices are very close. This option is going to be used in all candlestick patterns.
Factor for tolerating opening/closing price
The more the factor is, the more the tolerance is.
Body/Height ratio for a candle to be considered as Bullish/Bearish
A bullish/bearish candle shouldn’t have too much shadow. You can use this option to determine the shadow length of a bullish/bearish bar. This option is going to be used in all candlestick patterns
Use basic candlestick pattern (Doji, Spinning Top, Marubozu)?
Detect doji, spinning top, marubozu candlestick patterns.
Manually set body of Doji?
You can manually set the body height of a doji. Otherwise, it will be calculated automatically. If you choose to use this option, then spinning top, and marubozu will also be calculated based on this.
Body of Doji
Body height of a bar to be considered as doji . Any bar with a body equal or less than the given value will be marked as doji. Only effective if you check the ”Manually set body of Doji?” option .
Verify a Doji by looking at the preceding candle?
If true, it will only mark dojis if the preceding candle is bullish or bearish.
Single Candlestick Patterns
This module detects Hammer, Hanging Man, Inverted Hammer, Shooting Star single candlestick patterns.
Below are the inputs of this module:
Confirm Single Candlestick Patterns with next closing price?
You can confirm a single candlestick pattern with the next closing price. That is, if the next candle closes above the previous one, it will confirm a bullish movement. If the next candle closes below the previous one, it will confirm a bearish movement.
Use Hammer and Hanging Man Single Candlestick Patterns?
Detect hammer and h anging man single candlestick patterns.
Use Inverted Hammer and Shooting Star Single Candlestick Patterns?
Detect inverted hammer and s hooting star single candlestick patterns.
Dual Candlestick Patterns
This module detects Engulfing, Tweezer Bottoms, Tweezer Tops, Harami, Inside Bar, Piercing Line, Dark Cloud Cover dual candlestick patterns.
Below are the inputs of this module:
Use Engulfing Dual Candlestick Pattern?
Detect engulfing dual candlestick pattern.
Validate Engulfing by comparing highs and lows?
If checked, the second bar must engulf the previous bar’s high/low also. If unchecked, the second bar should only engulf the real body of the first bar.
Use Tweezer Bottoms and Tops Dual Candlestick Patterns?
Detect tweezer bottoms and tweezer tops dual candlestick patterns.
Check the shadow equality of Tweezer Bottom and Tops?
Check if the shadows of the tweezer bars are about the same length.
Detect Harami Dual Candlestick Pattern?
Detect harami dual candlestick pattern.
Use High/Low of the second Harami candle instead of Open/Close price?
If checked, the body of the child must be within High and Low of the mother bar. Otherwise, only open/close prices will be checked.
Detect Inside Bar Dual Candlestick Pattern?
Detect inside bar dual candlestick pattern.
Treat Inside Bar as a reversal pattern?
If checked, inside bar will be treated as a bullish/bearish reversal pattern.
Check if the Inside bar formed in the upper/lower half of the Mother bar?
Check if the inside bar forms within the upper/lower body half of the mother. Then it will be treated as a bullish/bearish inside bar .
Detect the Inside Bar only if the previous candle closes outside of the Keltner channel?
This option effects identifying the inside bar . Such that, an inside bar will be detected only if the previous candle closes outside of Keltner Channel . Inside bars are effective when the market is extended and this is a nice way to check for that.
Confirm Inside Bar with the next close breaching the low/high of the inside bar?
Check if the next bar breaches inside bar’s high/low. Then it will be treated as a bullish/bearish inside bar .
Use Piercing Line and Dark Cloud Cover Dual Candlestick Patterns?
Detect Piercing Line and Dark Cloud Cover dual candlestick patterns.
Triple Candlestick Patterns
This module detects Morning Star , Evening Star, Three White Soldiers, Three Black Crows, Three Inside Up, Three Inside Down, Three Line Strike, Abandoned Baby, NR4, NR7 candlestick patterns.
Below are the inputs of this module:
Use Morning and Evening Star Triple Candlestick Pattern?
Detect morning and evening star triple candlestick patterns.
Don't allow the second candle's body to overlap with the first and third candle?
If checked, high and low of the second candle cannot overlap with the first and third candle for morning and evening star candlestick patterns.
The third candle must close beyond the midpoint of the first candle?
If checked, the third candle must close beyond the midpoint of the first candle for morning and evening star candlestick patterns.
Use Three White Soldiers and Three Black Crows Triple Candlestick Pattern?
Detect three white soldiers and three black crows triple candlestick pattern.
Compare bodies of Three White Soldiers and Three Black Crows candles?
You also have the possibility of comparing bodies of the candles in a way that every consecutive candle must have a bigger body than the previous candle.
Check if each candle (TWS&TBC) opens in the middle price range of the previous day?
You can check if each candle of three white soldiers and three black crows opens in the middle price range of the previous day.
Use Three Inside Up/Down Triple Candlestick Pattern?
Detect three inside up and three inside down triple candlestick pattern.
Check candles' bodies and closing prices for Three Inside Up/Down?
There are two different definitions for three inside up/down candlestick patterns. This option allows you to select one of those definitions. That is;
If unchecked , the second candle should make it up all the way to the midpoint of the first candle. Also, the third candle needs to close above the first candle’s high.
If checked , the second candle opens and closes within the real body of the first candle. Also, the third candle needs to close above the first candle's high.
Use Three Line Strike Candlestick Pattern?
Detect three line strike triple candlestick pattern.
Compare High/Lows instead of Open/Close for the Three Line Strike Pattern?
If checked, it will compare high/lows instead of open/close prices for the three line strike pattern.
Use Abandoned Baby Triple Candlestick Pattern?
Detect abandoned baby triple candlestick pattern. If you choose to tolerate opening and closing prices, high and low prices will also be tolerated for abandoned baby.
Use NR4 Candlestick Pattern?
Detect NR4 candlestick pattern.
Use NR7 Candlestick Pattern?
Detect NR7 candlestick pattern.
Confirm Narrow Range Candlestick Patterns with next closing price?
You can confirm NR4 and NR7 candlestick patterns with the next closing price. That way they will be identified as bullish or bearish patterns.
NOTES FROM THE AUTHOR
Please do not hesitate to contact me if you have any questions.
If you are not familiar with a specific candlestick pattern, try to google it. If you still need help, you can always contact me.
If you find a bug, or you think the indicator does not work as intended, please contact me with a screenshot of the chart. Also, please mention how you set up the user inputs.
If you have any ideas to further improve this indicator, please feel free to share it with me :)
LIKE , if you like it. SHARE if you think it would be useful for others too. FOLLOW for future updates and new indicators.

[NORTH2025] N.E.S.T. — Nebula Encapsulated Star TrapOverview
N.E.S.T. CORE (Nebula Encapsulated Star Trap Core Engine) is a multi-system Inside Bar detection and trading framework that combines 5 unique Inside-Bar-based strategies into a single, unified engine.
Each system captures different forms of market compression and consolidation — similar to stars being trapped inside multiple layers of a nebula — and converts that structure into breakout-ready trade setups.
N.E.S.T. CORE is designed for swing/positional traders who use 4H timeframe , multi-layer Inside Bar structures, and breakout continuation patterns.
---
Key Features
✔ 5 Inside Bar Systems in One Script
Each system has its own logic, direction rules, signal placement, risk evaluation, and independent Win/Draw/Loss tracking.
1. S1 – NEST-2NFV
* Double Inside Bar (Nested chain: child inside parent, grandchild inside child)
* Direction determined by 3-bar Vote
* EP/SL based on the Mother Bar
2. S2 – NEST-2CFM
* Double Inside Bar (Cluster type: both inside bars must be inside Mother Bar, not each other)
* Direction from Mother Bar
3. S3 – NEST-3CFM
* Triple Inside Bar (Cluster of 3 inside bars inside the same Mother Bar)
* Direction from Mother Bar
4. S4 – NEST-3BOM
* Triple Inside Bar
* Buy-Only version (Prime Variant)
* Direction from Mother Bar
5. S5 – NEST-5CFL
* Five Inside Bar Cluster
* Direction determined by the last Inside Bar(final compression bar)
---
✔ Auto-Backtesting for Each System
Every system runs its own internal backtest engine:
* Win / Draw / Loss
* Break-even logic after hitting +1R
* Max Consecutive Loss tracking
* Visual summary table on the chart
All systems update independently and do not interfere with one another.
---
✔ Smart Visual Layering (No Overlap)
Each system draws its signal label at a different orbital altitude based on Mother Bar range.
This prevents label overlap and creates a clean, layered cosmic layout:
* S1 at orbit 1
* S2 at orbit 2
* S3 at orbit 3
* S4 at orbit 4
* S5 at orbit 5
All labels use cosmic-themed colors matching their system identity.
---
✔ SL/TP Engine with RRR 1:1.5
* EP placed at Mother Bar breakout
* SL placed at the opposite side of Mother Bar
* TP = EP ± 1.5×R
* Signals are filtered by Maximum SL distance (in pips) to avoid oversized trades
---
✔ Universal Broker Compatibility
Although the system tags indicate origin (F = Forex.com, O = OANDA),
the script is fully compatible with any broker on TradingView.
---
✔ 4H-Only + 5-Year Lookback Optimization
This engine is optimized for:
* 4H timeframe (auto-restrict)
* Recent 5-year data to maintain speed and performance
* Average 7,000–8,000 bars
Ensuring stable performance and avoiding unnecessary resource load.
---
Recommended Use
This indicator is best suited for:
* Swing traders
* Price action / Inside Bar traders
* Breakout and continuation strategy users
* Traders who want multi-system confirmation
* Traders studying Inside-Bar compression patterns for algorithmic behavior
Works well with:
* Support/Resistance
* Trend structure
* ATR volatility
* Market session timing (NY/London)
---
Disclaimer
N.E.S.T. CORE is not a financial advice tool.
Use proper position sizing and risk management.
Past performance does not guarantee future results.
---
Final Words
N.E.S.T. CORE is designed as a cosmic-themed, multi-layer Inside Bar engine , giving traders one of the most complete Inside Bar toolkits available on TradingView — from nested patterns to cluster patterns, multi-direction logic, buy-only variants, and 5-bar compression signals.
Enjoy exploring the market with the power of the nebula.
Clear skies ✨🚀
---
NORTH 2025

SMC ToolBox [WinWorld]👋 INTRODUCTION
SMC ToolBox indicator is not just a simple indicator, but rather a collection of SMC-related algorithms, that our teams has found to make the most profound impact on determination process of the most high-quality liquidity zones and points of interests ( further – POIs ), hence the name of the indicator – Tool Box (and it also sounds cool :) .
From candle patterns to complex orderflow detection algorithm, ToolBox indicator will help any trader with search for useful tools, solving the needs from confirming position entry levels to trend-following and mean reversion opportunities.
❓ WHY DID WE BUILD THIS?
This indicator was initially built for our team's internal use for the sole purpose of gathering all actively used non-structure-related algorithms* in one place, so we could have only the tools that are truly needed at hand at any point of time. After we showed this tool to our trading partners, they were surprised about how light, fast and useful ToolBox was and they advised us on sharing this with our community and, after giving it a proper thought, we decided to follow their advice.
Funnily enough , after researching TradingView's open-source script library, we haven't found even one instance of even remotely alike indicators, so it fair to say that we are one of the first people to release this kind of SMC-related indicator bundles on the market and we strongly that TradingView's community will find this tool of use.
🤷♂️ WHY SHOULD YOU CARE AT ALL?
Frankly speaking, we are not the first people to build our own algorithms of such popular indicators like Equal Highs and Lows (EQHL), Previous Day High Low (PDHL), Orderflow (OF) and etc., but we are definitely one of the first teams to implement these indicators with the help of algorithms, that are actually used by the most professional traders on YouTube and other social media trading influencers. Simply taking trades from our SCOBs, OFs, EQHLs and etc. won't print you millions overnight, but what these algos will do is help you with being aware of is potentially laying ahead of you with a very clean probability.
Why does it matter? It simple: better market awareness gives you an edge over other trades, which use old algorithms, which are clearly outdated, so beating such traders in the long run is just a game of time for you, so good algorithms do matter. Each indicator inside ToolBox is there to help you develop this market awareness and forge your edge bit by bit.
Now let's talk about what is inside the ToolBox.
🔍 OVERVIEW
At the moment of publishing ToolBox contains 8 indicators, so say "Hello" to:
Price Border Bands (further – PBB) ;
Ordeflow (further – OF) ;
Equal Highs & Lows (further – EQHL) ;
Previous Day High & Low ( further – PDHL) ;
Single Candle Order Block (further – SCOB) ;
Institutional Funding Candle (further – IFC) ;
Engulfing Candle (further – EC) ;
Inside Bars (further – IB) .
Some of them you may know, some of them you may not, so let's review each of them one by one.
📍 INDICATOR: Price Border Bands (PBB)
Price Border Bands indicator is a simple yet useful algorithm, based on Triangular Moving Average (TMA), which helps determine extreme price spikes, which on average act as meaningful mean reversion opportunities. It also is a good an effective "verifier" of POIs and zones of interest (further – ZOI) .
We advise on using this indicator this way:
Look for price going beyond upper or lower band of PBB;
Look for price reaching POI or ZOI;
Start searching for your entry point.
The most common sign of potential price reversal, which PBB searches for, is intense price spike, which signals about "liquidity clearing" or, in simple terms, manipulation .
Manipulation of the price inside the POI or price being "stopped" by POI is a screaming sign of the potentional following reversal. See the example of such situation on the screenshot below:
Additionally we need to talk about trend filter inside PBB, which colours the bars on the chart under certain conditions. If bars on the chart are being coloured in gray – this is your sign to stop trading on this asset? because there is risk to catch an uncomfortably big price spike, which might turn the '+' of your position's PnL in to '-'. See the example of PBB highlighting bar's of risky price zone in gray colour on the screenshot below:
In order to continue trading you need to wait for bars to stop being coloured in gray OR confirm the fact that price made Change of Character (ChoCh) in reverse to the previous direction of price, which was marked as risky by PBB.
And last but not least: if you see POI being reach by price inside the bands of PBB, then consider this POI weak and avoid trading it. See the example of weak POI inside PBB bands on the screenshot below:
📍 INDICATOR: Orderflow (OF)
Orderflow indicator is an algorithm, which detects Sell-to-Buy (furthert – STB) or Buy-to-Sell (further – BTS) manipulations, using the algorithm of impulse & correction price movement detection, taken from one of our previously built indicators – Impulse Correction SCOB Mapper (ICSM) .
Let's explain the terms from above:
Impulse – series of bars, each bar of which consecutively updated previous bar's high and then last candle broke previous bar's low ;
Correction – series of bars, each bar of which consecutively updated previous bar's low and then last candle broke previous bar's high ;
STB – a type of price manipulation, which can be described as a correction of price inside global upward movemnt;
BTS – a type of price manipulation, which can be describd as a impulse of price inside global downward movement.
Unlike traditional order blocks, which are often narrower and more selective, Orderflow zones cover a wider price range and present a higher probability of mitigation. This makes them more reliable for entries in ovaerage in comparison to classic orderblocks.
Let's review examples of bullish and bearish orderflows on the screenshots below:
Bullish orderflows (STBs) (blue boxes with "OF" text inside)
Bearish orderflows (BTSs) (orange boxes with "OF" text inside)
The usage of ZOIs, detected by OF algorithm, is pretty straightforward: take trades against the ordeflow block, that price has reached. Even though we don't recommend relying on Orderflow blocks as sole producers of signals, you can use them as such in way, that can be described like this:
Place stop-loss (SL) beyond the furthest border of OF block (bottom of the bullish OF or top of the bearish OF), that price has reached;
Aim for >2:1 RR ratio and place your take-profit (TP) accordingly.
You can see the example setups of OF blocks as signal producers on the screenshots below:
Examples of LONG trades, taken from price reaching bullish OF block.
Examples of SHORT trades, taken from price reaching bearish OF block.
Summarising, Orderflow can be described as a tool that helps determine the STB and BTS price manipulations, which are great price ZOIs and can be used both as confirmation tools for your exisiting signals and sole signal producers, in which case such they needed to be handled extra mindfully and preferrably bonded with other tools for additional confirmation. We personally recommend using Ordeflow as confirmation tool, because ZOIs, detected by Orderflow, are usually the price ranges, around which traders tend to place their stop-losses, which only gives more strength to these zones for supporting the price and helps traders with "trading from support/resistance" strategies gain additional edge.
📍 INDICATOR: Equal Highs & Lows (EQHL)
EQHL indicator is an algorithm, which scans the extremums of impulse and correction movements, detected by our ICSM indicator , and marks ones which are roughly or equaly placed on the same price levels. Equal highs (further – EQH) and equal lows (further – EQL) are local liquidity pools, where stop orders and resting orders cluster; price often gravitates to these zones for liquidity “top-ups,” after which a reaction or continuation to the next liquidity source may occur. Basically, EQHL algorithm highlights clusters of equal extremes as navigational anchors for “collect → react → confirm” scenarios.
Talking about usage, we advise to not take swept or reached EQHLs as entries by themselves. Evaluate them alongside HTF structure, Inducement (IDM), orderblocks (OB), orderflow (OF), candle pattern context (e.g., IFC/EC) on the LTF and etc. Intended usage scenario of this algorithm is something like this:
Price reaches EQH/EQL;
Price hangs around the reached EQH/EQL;
Another tool (for example, OF or OB) signals about price reversals from the level of reached EQH/EQL;
Trader starts looking for an entry.
See the examples of EQHLs, which algorithms maps on the chart, on the screenshots below:
Equal Lows (EQLs)
Equal Highs (EQHs)
📍 INDICATOR: Previous Day High & Low (PDHL)
PDHL indicator is an algorithm, princples of work of which can be derived from its name: algorithm tracks previous day's high and low and displays it on the chart.
Previous day's high and low are fundamental POIs in any financial market, which are traded not only by SMC traders, but by many other traders, especially by traders, which consider these POIs are one of the most crucial, because they usually highly liquidity-rich and can signal about wondeful reversal opportunities.
We expect traders to use PDHL algorithm as confirmation tool when trading by mean reversion strategies. Usage of PDHL as signal source is advised against, but traders are free to experiment nevertheless.
PDHL algorithm shows two types of PDHLs on the chart: active PDHL (solid line) and swept PDHL (dashed line) . You can the examples of PDHLs, detected by our algorithm, on the screenshot below:
📍 INDICATOR: Single Candle Order Block (SCOB)
SCOB indicator is an algorithm, which marks a very specific POIS, which are based on of the most simple yet highly profound SMC and candle pattern principles and are usually a good alternative for classic orderblocks.
Principles of SCOB detection are very simple:
Price sweeps previous candle's extremum (high/low). So called "liquidity sweep" ;
Immediately after step 1 price forms a fair value gap (FVG).
You can see basic examples of bearish and bullish SCOBs on the screenshot below:
As a matter of fact, SCOB can be used both as a confirmation tool and source of signals. However! To be a source of signals, SCOB is most suitable to be used while trading on lower timeframe (LTF), while trading on a higher timeframe (HTF) on average requires to look at SCOB as a POI rather than as independent source of signals. That being said, we would like additionally to point out, that due to the nature of SCOB being an orderblock, this tool by its nature is best suitable as confirmation tool and we expect traders to use it as such, but either way this indicator is quite multifunctional and can be used by each trader for a more specific purposes.
SCOBs, which are detected by our algorithm, are painted on the chart either as coloured candles (SCOBs without inside bars) or coloured boxes (SCOBs with inside bars) . You can see examples of SCOBs, which were detected by our SCOB algorithm, on the screenshot below:
📍 INDICATOR: Institutional Funding Candle (IFC)
IFC is a candle, which is a more strict version of SCOB. Our algorithms detects an IFC, if SCOB satisfies these conditions:
SCOB candle has large shadow (more than 50% of candle's body);
SCOB candle has large range ( | high - low | is more than a certain value, which is base on ATR).
That's basically it! Being simple as that, IFC represents itself as a high-trust SCOB, which on average has larger chance of reversing price when IFC candle is reached by it and our practice shows that it is indeed the case. IFC candles are usually go hand in hand with large price and volume spikes, which are believed to be caused by large institutional players, who trading eager to catch retail trader's stop orders, which they usually place around POIs like IFC and SCOB.
We expect traders to use IFC as a tool for entry confirmation bias, especially when considering IFC from HTF.
You can see IFC, which our algoritms detects on the chart, on the screenshot below:
📍 INDICATOR: Engulfing Candle (EC)
An Engulfing Candle is a candle, which occurs when the current candle’s body engulfs the prior candle’s body, showing a short-term shift in demand/supply balance. In SMC context, it is most useful around POIs/liquidity as a contextual confirmation element. The indicator marks bullish and bearish EC without implying a “must reverse” outcome – it’s a focus cue, not a promise.
As with any other alike tool, this algorithm should not be used as sole source of signals, but rather as a confirmation tool. ECs near support/resistance zones or POIs are typically more impactufl than those inside choppy consolidations. Structural and LTF price impulse confirmation usually enhances existing position bias in a positive way.
You can see examples of engulfing candles on the screenshots below:
Bullish engulfing candles
Bearish engulfing candles
📍 INDICATOR: Inside Bars (IB)
Inside Bars are bars, which are contained inside the range of high and low prices of the bars preceding them. This algorithm was designed to showcase periods of potential price consolidation/volatylity compression and quite often precedes price movement towards closest liquidity POIs and ZOIs. When price finally breaks out of its previous range, it usually provides good opportunities for entering trades using breakout strategies (especially ones, that are based on SMC principles) .
You can see examples of IBs, which are detected by our algorithm on the chart, on the screenshot below:
That was a long list of features, now let's talk about settings now.
🔔 WHAT ABOUT ALERTS?
At the moment of publishing this indicator includes alerts for all algorithms, which are included inside, except for Inside Bars (IB) algorithm .
⚙️ SETTINGS
At the moment of publishing most of the settings in this indicator are about styling for indicator's visuals, because by design most of the included algorithms (excluding PBB) don't rely on inputs of any technical kind. Let's review them.
ToolBox | General Styling
Text Size – (Tiny, Small, Normal, Large) – defines text size of indicator's visuals, which use text-based visuals.
Price Border Bands | Main Settings
Show Price Border Bands – toggles on/off the display of PBB;
Half Length – defines amount of bars, used for calculation of the PBB's TMA;
Price Source – defines price source for PBB's TMA;
ATR Multiplier – affects the width of PBB's bands;
ATR Period – affects the amount of bars for ATR calculation.
Orderflow (OF) | Settings
Bullish OF – toggles on/off the display & colour of bullish OF;
Bearish OF – toggles on/off the display & colour of bearish OF;
Show border – toggles on/off the display of OF blocks' border.
Single Candle Order Block (SCOB) | Settings
Show SCOB – toggles on/off the display of SCOB;
Bullish – toggles on/off the colour of bullish SCOB;
Bearish – toggles on/off the colour of bearish SCOB.
Equal High/Lows (EQHL) | Settings
Show EQH/EQL – toggles on/off the display of PDH/PDL;
EQH – toggles on/off the colour of EQH;
EQL – toggles on/off the colour of EQL.
Institutional Funding Candle (IFC) | Settings
Show IFC – toggles on/off the display of IFC;
Bullish – toggles on/off the colour of bullish IFC;
Bearish – toggles on/off the colour of bearish IFC.
Previous Day High & Low (PDHL) | Settings
Show PDH/PDL – toggles on/off the display of PDH/PDL;
Show PDH/PDL – toggles on/off the display of the past history of swept PDH/PDL;
Show previous day divider – toggles on/off the display of dashed gray line, which separates new day from previous one;
Bullish – toggles on/off the colour of bullish IFC;
Bearish – toggles on/off the colour of bearish IFC.
Engulfing Candle (EC) | Settings
Show engulfing candles – toggles on/off the display of EC;
Bullish – toggles on/off the colour of bullish EC;
Bearish – toggles on/off the colour of bearish EC.
Inside Bars (IB) | Settings
Show inside bars – toggles on/off the display of IB;
Bullish – toggles on/off the colour of bullish IB;
Bearish – toggles on/off the colour of bearish IB.
Alerts | POI
Alert Frequency – (Once Per Bar, Once Per Bar Close) – defines alert frequency of the indicator's alert for all POIs;
* all other buttons from this group of settings toggle alerts on/off.
PBB;
OF;
SCOB;
EQH;
EQL;
IFC;
PDH;
PDL;
EC.
🏁 AFTERWORD
SMC ToolBox indicator is designed to be the ultimate swiss knife, which might bring you quantifiable results when trying to crack the market's secret of where the liquidity is placed. This indicator doesn't produce any particular signals not it gives any financial advice, but it helps you deepen understanding about potential existing liquidity zones and price points by employing principles of SMC algorithms, which are most commonly used by retail traders on a daily basis.
You can view this indicator as a Christmas candy box: you pick only the candles (indicators) you need and want. We expect any trader to use this indicator by exactly same way: you should take onlt the things you need to enhance your strategy, not worrying about what to do with other indicators, fi they don't suit you.
Lastly, we would like to share our team's recommendations (they are optional, of course) on how to use certain POIs from ToolBox:
Use PBB as a filter for validating POis. Pay close attention to the rule "don't trade POIs, which are located inside the bands of PBB" (described above in "INDICATOR: PBB") ;
Use Orderflow to find short-term and mid-term trading opportunitions for trend-following strategies, using OF blocks as resistance in bearish trend and support in bullish trend;
Use EQHL and PDHL indicators when trading by mean-reversion strategies on intraday timeframes. These indicators will be especially of use to forex, stock and crypto traders;
Use SCOB and IFC indicators when trading by mean-reversion strategy to find short-term reversal opportunities;
Use ECs and IBs as confirmation/denial tools for your entry ideas. We recommend avoiding trading If price is currently going inside HTF's IB range.
We have no doubts that SMC ToolBox indicator will be of use to any trader, who employs and desire to employ SMC principles in his strategy. We will be waiting for your feedback, meanwhile you can ask your questions in the comments :)
Sincerely,
WinWorld team.

Emmanuel Optuma Bar Colors v2This script colours TradingView’s Bar Chart to follow a simple, powerful bar-type logic used in Optuma-style analysis.
It makes the chart easier to read by showing the relationship between:
Up bars
Down bars
Outside bars
Inside bars
🔍 Bar Type Detection
Up Bar
Close > Previous close
→ Indicates upward strength
→ Coloured Green
Down Bar
Close < Previous close
→ Indicates downward pressure
→ Coloured Red
Outside Bar
High > Previous high and Low < Previous low
→ Market expands its range
→ Coloured Blue
Inside Bar
High < Previous high and Low > Previous low
→ Market contracts inside the previous bar
→ Follows previous bar’s colour
🎨 Colour Rules Summary
Bar Type Colour Meaning
Up Bar 🟩 Green Bullish pressure
Down Bar 🟥 Red Bearish pressure
Outside Bar 🔵 Blue Range expansion, bar resets structure
Inside Bar Same as previous bar Market indecision, continuation
🧠 Inside Bar Logic (Very Important)
Inside bars always copy the colour of the previous bar, which means:
If the previous bar was Green → inside bar becomes Green
If the previous bar was Red → inside bar becomes Red
If the previous bar was Blue → inside bar becomes Blue
This keeps the structure visually consistent and easy to read.
📈 Why This Helps Traders
This approach makes it easier to see:
✔ Trend continuation
Inside bars keep the trend colour, making swings clearer.
✔ Trend weakness
Inside bars after outside bars show contraction.
✔ Breakouts
Blue outside bars stand out as moments of range expansion.
✔ Market rhythm
The chart becomes easier to follow for beginners and advanced traders.
🧩 How to Use It
Set chart type to Bars
Add the script
Hide default colours (barcolor replaces them)
This instantly transforms TradingView into a teaching-friendly chart like Optuma.
